 (ps)
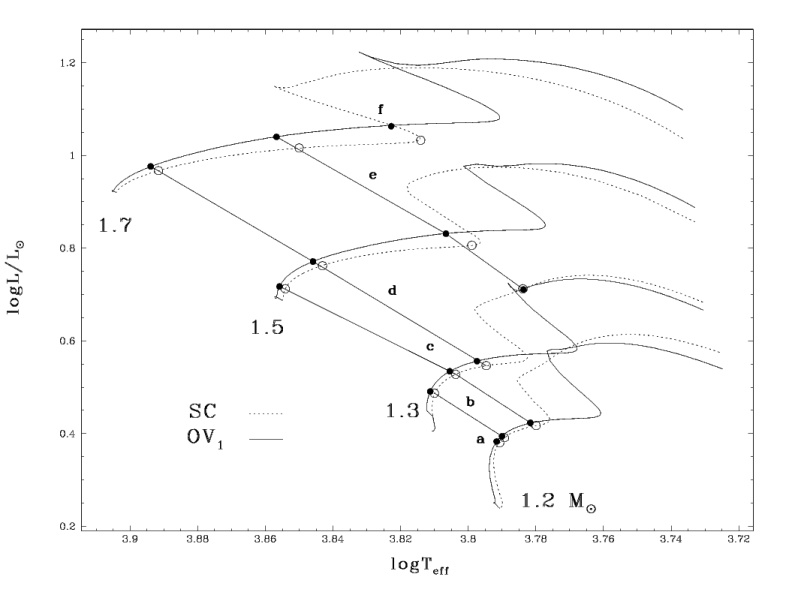
(ps)Some standard stellar parameters for all
the models may be found in the Table below. These are central hydrogen
abundance (Xc), core radius relative to the stellar radius (xcc), mass
fraction in the core (mcc), evolutionary status of the core (dmcc: +
expanding, - contracting, 0 no core). For each model two data files are
available: spectrum and small separation.
| LY | SC | |||||||||
| Xc | xcc | mcc | dmcc | data | Xc | xcc | mcc | dmcc | data | |
| M2a | 0.291 | 0.046 | 0.021 | + | spec ssep |
0.304 | 0.048 | 0.022 | + | spec ssep |
| M2b | 0.248 | 0.048 | 0.024 | + | spec ssep | 0.276 | 0.051 | 0.029 | + | spec ssep |
| M2c | 0.083 | 0.047 | 0.036 | - | spec ssep | 0.143 | 0.054 | 0.047 | - | spec ssep |
| M2d | 0.000 | 0.000 | 0.000 | 0 | spec ssep | 0.005 | 0.014 | 0.028 | - | spec ssep |
| M3b | 0.474 | 0.085 | 0.034 | + | spec ssep | 0.479 | 0.086 | 0.036 | + | spec ssep |
| M3c | 0.323 | 0.095 | 0.053 | + | spec ssep | 0.335 | 0.097 | 0.055 | + | spec ssep |
| M3d | 0.206 | 0.096 | 0.059 | - | spec ssep | 0.223 | 0.099 | 0.052 | - | spec ssep |
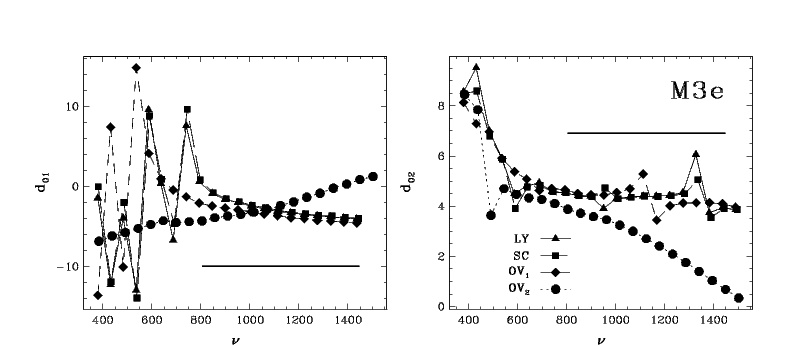
| M3e | 0.000 | 0.000 | 0.000 | 0 | spec ssep | 0.000 | 0.000 | 0.000 | 0 | spec ssep |
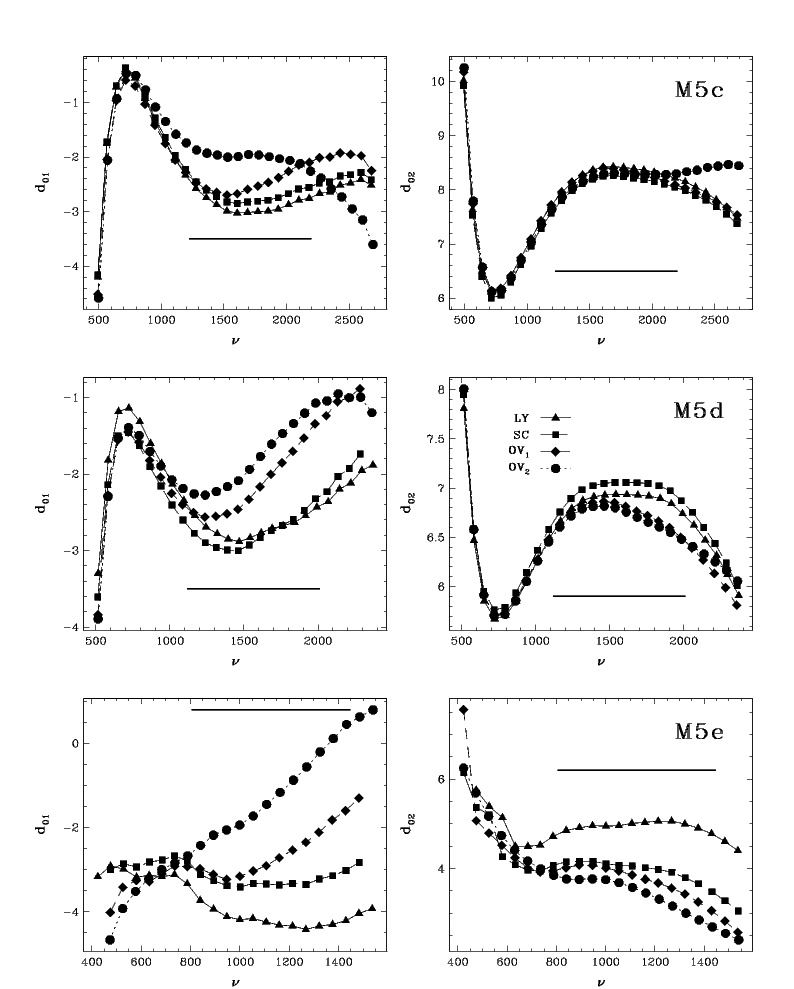
| M5c | 0.565 | 0.083 | 0.079 | + | spec ssep | 0.565 | 0.084 | 0.080 | + | spec ssep |
| M5d | 0.466 | 0.079 | 0.085 | + | spec ssep | 0.467 | 0.079 | 0.087 | + | spec ssep |
| M5e | 0.065 | 0.050 | 0.064 | - | spec ssep | 0.091 | 0.052 | 0.070 | - | spec ssep |
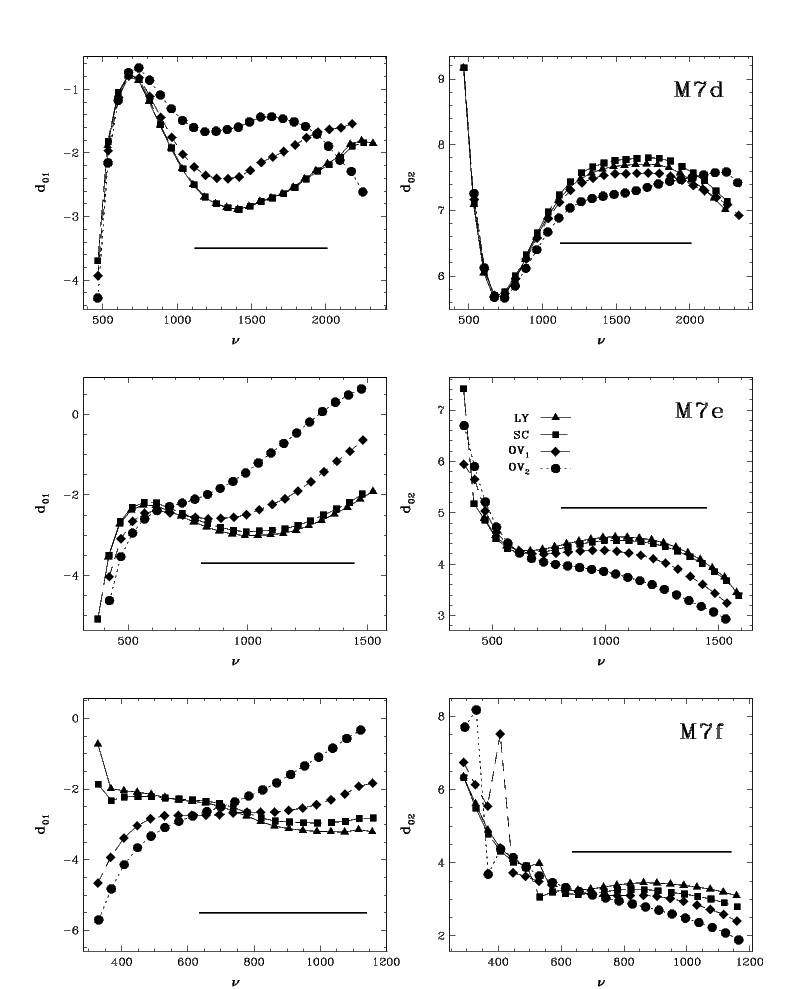
| M7d | 0.539 | 0.095 | 0.111 | + | spec ssep | 0.546 | 0.096 | 0.112 | + | spec ssep |
| M7e | 0.260 | 0.146 | 0.095 | - | spec ssep | 0.270 | 0.069 | 0.096 | - | spec ssep |
| M7f | 0.035 | 0.114 | 0.065 | - | spec ssep |
0.054 | 0.048 | 0.069 | - | spec ssep |
 (
( (
( (
( (
( (
( (
(