click here for ABSTRACT

MATCHING PURSUIT IN ERP ANALYSIS - AN APPLICATION TO VIBROTACTILE DRIVING RESPONSES

J. Żygierewicz, D. Ircha, E. F. Kelly*, M. Niznikiewicz**, K.J. Blinowska, P. J. Durka

Warsaw University; *The University of North Carolina at Chapel Hill; **Harvard Medical School
ERPs can be thought of as signals of changing time-frequency characteristics, which can not be easily perceived by means of conventional methods of signal analysis. A new method of time-frequency analysis based on Matching Pursuit (MP) algorithm [1] offers high resolution parametric description of non-stationary signals. full screen full screen
MP relies on decomposition of the signal into waveforms taken from a large and redundant dictionary, generated by scaling, translating and modulating one window function (usually Gaussian). Waveforms from such a dictionary are fitted to the signal by means of an iterative non-linear procedure, which offers a linear decomposition of signal into waveforms of well defined time-frequency parameters. The decomposition enables to derive a cross-terms free representation of signal's energy density in time-frequency plane (see Wigner plots, right). full screen full screen
Presented simulations (figures on the right) indicate, that structures appearing in the signal in the same time instant with different frequencies (C,D) or with the same frequency, but in different but close time moments (D,E), are easily resolved. Addition of noise of two times higher energy (S/N=-3dB) than the signal (upper pair of plots) does not affect significantly the MP parametrization of simulated signal's structures. full screen
ABOVE:
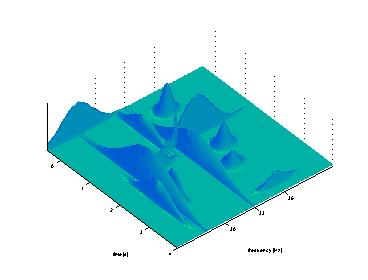
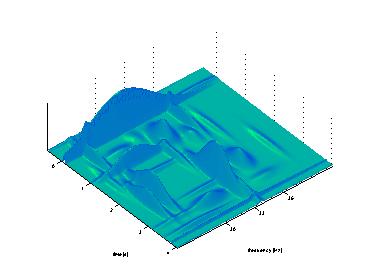
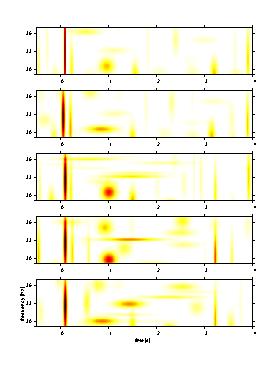
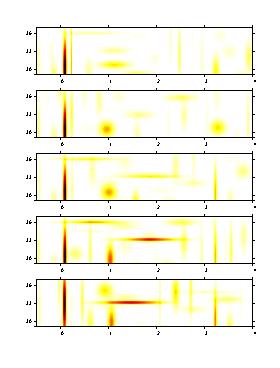
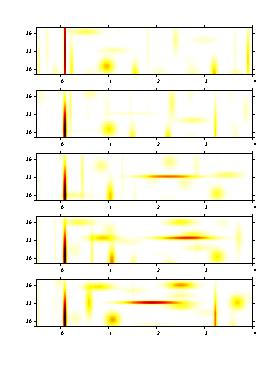
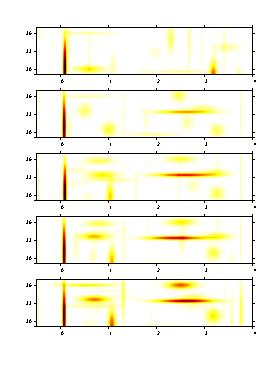
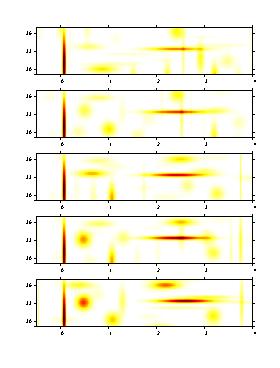
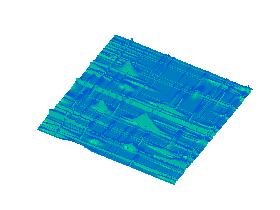
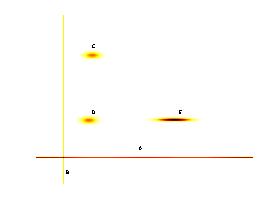
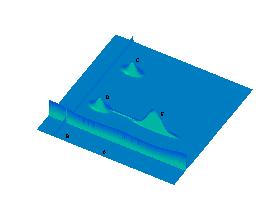
2-dimensional (left) and 3-dimensional (right) distributions of simulated signals energy in time-frequency coordinates - top with addition of noise (S/N = -3 dB), lower without noise. On 2-D plots energy increases from yellow to red, on 3-D plots energy is proportional to the height. Parameters of time-frequency structures are listed in a Table
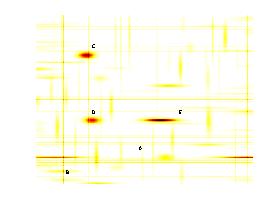
LEFT:
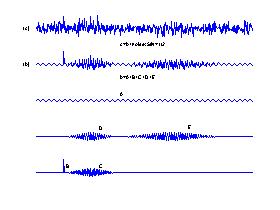
lowest three traces - components of the simulated signals: sinusoid (A), Dirac's delta (B), spindles (C,D,E), b - sum of these structures, c - signal b plus noise of energy twice the signal's (S/N = -3 dB).


Application of MP to the ERP analysis demonstrates its ability to extract signal components in low S/N ratios.

33 Hz vibrotactile stimuli of four different amplitudes (50,100,200,400 micrometers, 200 repetitions each) were applied to the right fingertip of a human subject. EEG signals were recorded from a 5x5 array of electrodes centered over the left hand somatosensory area.


Time-frequency energy distribution of a single trial ERP, obtained by means of MP procedure, is shown below. Driving response is reflected clearly by the structure at about 33 Hz which extends through most of the stimulus period. However, plots constructed for single ERPs are usually more cluttered and complex, especially for lower stimulus amplitudes.

Next panel (below) presents the same magnitude calculated for the average response. 33 Hz component is well visible, however the picture is not as clear as this of single response. This is a consequence of the fact, that the manifestations of short term cortical dynamics are inconsistent in phase and therefore disturb the average picture.
BELOW:
Wigner plot of response to the 200 micrometers stimulus, averaged over trials.
RIGHT: Time-frequency (Wigner) plot obtained from the MP decomposition of a single trial (400 micrometers stimulus). Each point on the surface occupies the time-frequency position indicated by its projection on the axes, and its elevation is proportional to the energy density of the signal at that position.

BELOW: Wigner plots derived from averaged signals (200 micrometers stimulus). Array of plots organized topographically relative to positions of the 5x5 array of applied electrodes. Energy increases from yellow to red.

full screen full screen
full screen full screen full screen full screen full screen
The above plots present changes of the response: in the time-frequency plane, and in relation to the topographic position. The response undergoes progressive topographic changes not only in its overall amplitude, but also in its temporal structure. In the anteromedial positions (top left) a small response becomes just visible between 0.5 and 1.5 seconds after stimulus onset. Progressing across diagonal of the electrode array (2,2), (3,3) the main part of the response both enlarges and occurs later in the stimulus period, while in (3,3) it can be observed forming just after stimulus onset. In the most posterolateral channels (4,4), (5,5) the response remains consistently large, but also breaks up progressively into two distinct phases - an early burst of activity lasting about 0.5 seconds and a later sustained response which is sharply focused on the driving frequency and lasts the entire second half of the stimulus period. These spatiotemporally diverse patterns presumably reflect the differential activity of responding neural subpopulations occupying progressively shifted positions and orientations in SI cortical area 3b and 1. Conclusions
Analysis based on MP algorithm offers time-frequency representation of high resolution. It makes possible to extract properties of the single responses. The progressive evolution of the ERP depending on time and topography can be followed. These properties make MP approach a unique method of the study of evoked responses.

Acknowledgements
This work was supported by grants DE-07509 and TW-00185 from the NIH.

References:
  1. S. Mallat and Z. Zhang Matching Pursuit with time-frequency dictionaries, IEEE Trans. Sign. Process., 1993, 41:3397-3415
  2. Laboratory of Medical Physics: http://brain.fuw.edu.pl

PJD