|
Epilepsy is dynamical disease of
the
brain. Such diseases are characterized by a qualitative changes from
normal
behavior to abnormal dynamics. We may assume that epileptic brain
features two
states: the interictal state characterized by a normal
electroencephalography
(EEG) ongoing activity, and the ictal state, that is
characterized by
paroxysmal occurrence of synchronous oscillations and is generally
called, in
neurology, a seizure. An example of EEG recording during epileptic
seizure of
the absence type in human patient is shown in Fig. 1.
| Fig. 1.
An
example of
the EEG recording of absence epileptic seizure. Paroxysmal 3 Hz spike
and wave pattern emerges abruptly out of normal background and suddenly
ceases after few seconds. |
|
|
The question that we asked
ourselves was:
why a seizure starts and why does it stop? Rephrasing this question in
a more
formal manner: what are the dynamical mechanisms of transitions between
normal
and abnormal state? To answer this question we developed a
computational model
of the thalamocortical network. This network is considered to be
responsible
for generation of the absence epileptic seizures. The model diagram is
shown in
Fig. 2.
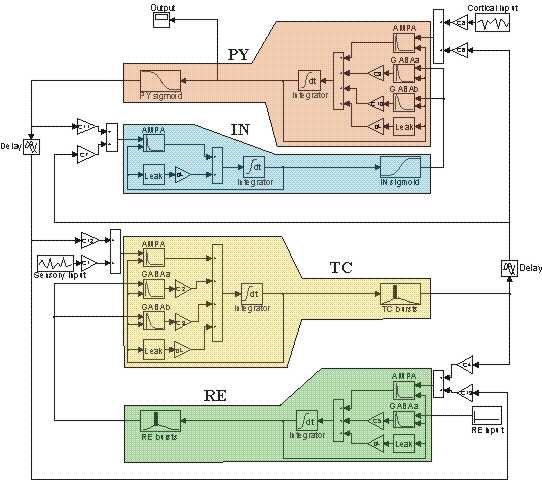
Fig. 2. Diagram of the
model of the thalamocortical network consisting of four neuronal
populations: PY - pyramidal cells, IN - cortical interneurons, TC -
thalamocortical relay cells, RE - thalamic reticular cells. The
Simulink code of the model is available at: https://senselab.med.yale.edu/ModelDB/showmodel.asp?model=111880 |
|
|
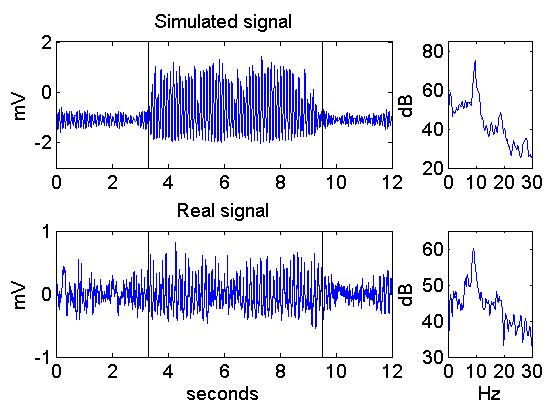
Model’s
activity corresponds to local field potentials or, in general,
to EEG
signals. An example of model simulation is shown in Fig. 3. One can see
that
model’s activity undergoes a change from normal behavior (small
amplitude) to
seizure-like activity (high amplitude oscillation) and back to normal
state.
Such transitions in the model occur spontaneously, i.e., they are not
induced
by model parameter changes. Understanding mechanisms of these
transitions in
the model may help to understand what happens in a real epileptic brain.
Fig. 3. An example of seizure-like activity
in the model (upper panel) and and seizure in an epileptic rat. The
model parameters were based on rat data, therefore the dominant
frequency of the modelled seizure signal is 9 Hz, comparable to the rat, as shown by power spectra on the right side.
|
|
|
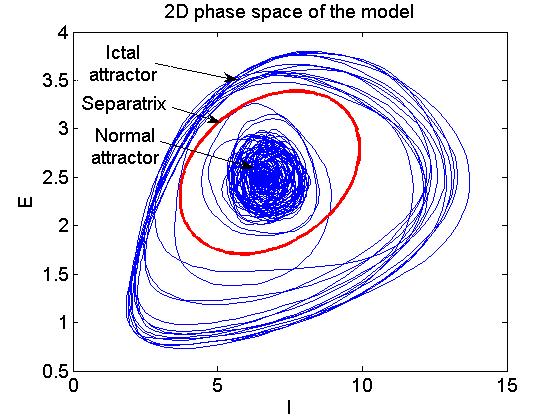
System
analysis showed that the model possesses bistable dynamics. In
other
words, for the same set of parameters the model may exhibit two types
of
activity: normal and seizure-like. Stochastic fluctuations present in
the
network may flip the system across the separatrix separating the two
coexisting states (attractors) as
illustrated, by means of phase-space reconstruction, in Fig. 4.
|
|
Fig. 4. Two dimensional reconstruction of
the model's phase-space showing two coexisting attractors -
normal and ictal, separated by a separatrix (red line). If the
trajectory is confined within the separatrix the system exhibits normal
activity. After crossing the separatrix, the system switches to ictal
attractor and seizure activity is generated. Due to fluctuations
present in the system, the trajectory switches between the two
attractors, what results in randomly occurring seizure onsets and
offsets. This figure appeared in Computer modelling of
epilepsy, W.W. Lytton, Nature
Reviews Neuroscience, 2008.
|
|
|
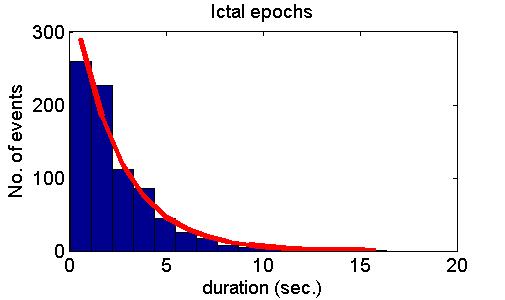
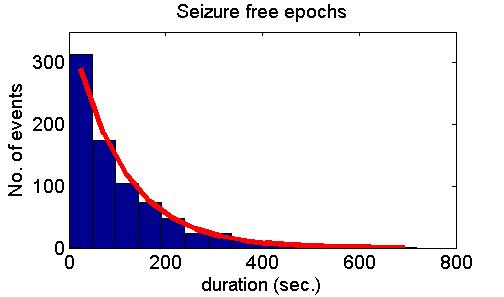
Experimental
validation
of model’s
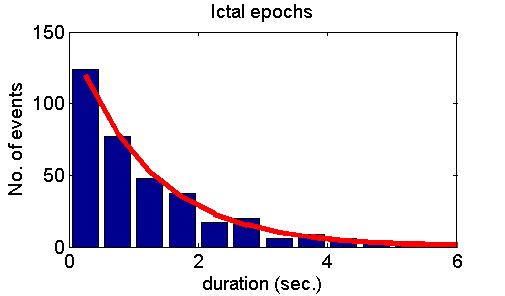
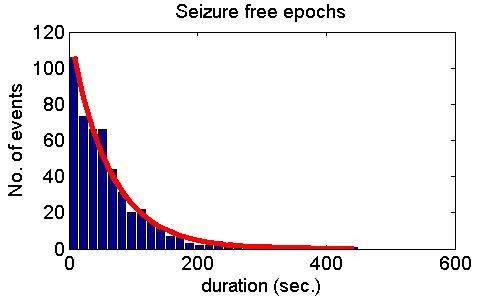
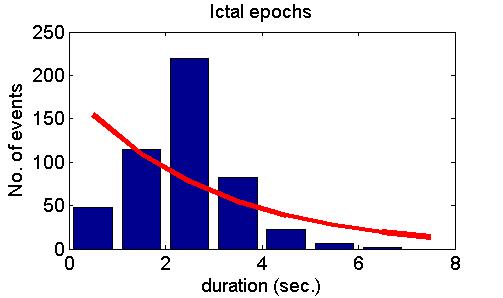
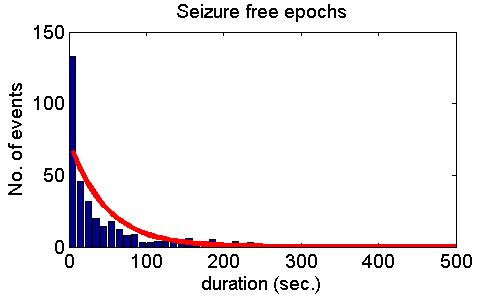
prediction is essential part of the modeling process. In the model, the
transitions between the two states occur randomly in time with constant
probability. Accordingly, the distributions of
durations of normal and seizure-like epochs are exponential.
(Derivation of
exponential distribution of inter-event durations from constant
probability
rate of event occurrence can be found here).
Analysis of long-term
experimental
recordings in human subjects and animal models confirmed model
hypothesis in
many cases but also refuted it in some other cases. Fig. 5 shows model
predictions (upper panel), examples of positive experimental validation
(middle panel) and examples clearly deviating from model predictions
(lower panel).
|
We may conclude that
our modeling work brought some new insights into fundamental laws
governing the
generation of epileptic seizures. At the same time new questions arose
such as:
which physiological mechanisms modulate the transition probabilities
and that are responsible for deviation from the exponential law?
New,
hypothesized mechanism can be included in the model and predictions of
the
extended model can be tested again against experimental data. This is
how a
progress can be made!
Finally, we should note that
here we considered
mainly seizures of the absence type originated in the thalamocortical
network.
Epilepsy is a heterogeneous disease that includes many seizure types.
Different scenarios of epileptic transitions are presented and
discussed in the review article Dynamical
Diseases of Brain Systems: Different
Routes to Epileptic Seizures,
Lopes da Silva et al., IEEE TBME 2003.
|
|