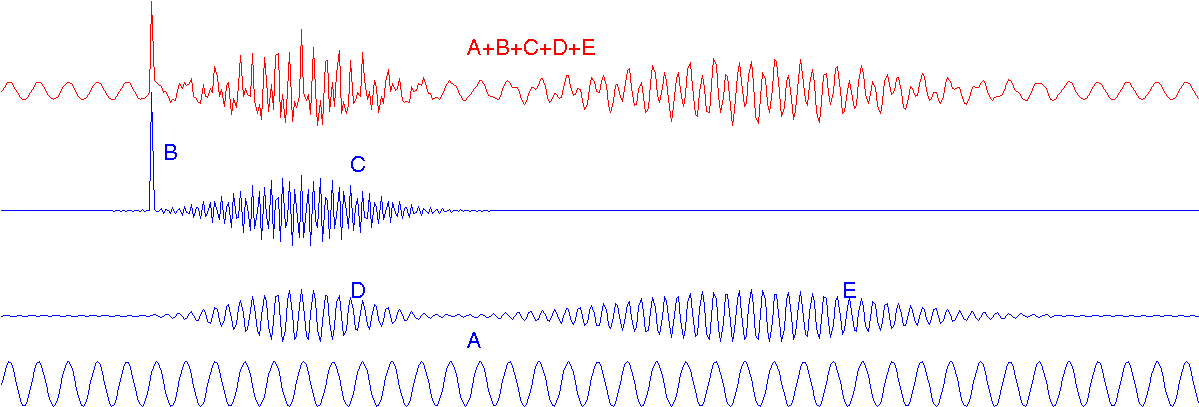
Illustrations of Time-frequency analysis: wavelets and adaptive approximations
As a practical example of "what the time-frequency analysis is all about"
we construct a puzzle:
let's make a signal constructed from known components - add them all
together - and see if one could guess what components we used! That can
serve as a metaphor for a big part of Signal Processing -
explain a signal through known functions. So, we'll use some canonical
shapes:

A - sine wave, C, D and E - sines modulated by Gauss (Gabor functions),
B - one-point discontinuoity (approximation of Dirac's delta).
Now let's see how some tools can help us solve this puzzle:
You might like to compare also the signal's
power spectrum
and spectrograms computed with window lengths
256,
128,
64,
32 and
16 points.
Java applets written by Dobieslaw
Ircha.
PLEASE NOTE, that the above examples by no means prove one method's superiority over the others, which is of course impossible on one signal's example. This example signal was generated from the waveforms present in dictionary used for MP decomposition.
