


Next: Regression analysis of the
Up: GT resonances from generalized
Previous: Study of .
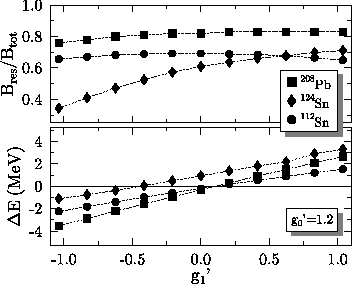
Figure 10:
Variation of the GT resonance energy and the strength in the
resonance when C1T (and thus g1') is varied. C1s
is readjusted for each value of C1T so that g0' = 1.2.
Symbols and scales are as in Fig. 6.
 |
Finally, we investigate the influence on the GT strength distribution of
the term
 ,
which
determines g1' [see Eq. (18)]. As this term is linked by
gauge invariance (11) to the time-even
,
which
determines g1' [see Eq. (18)]. As this term is linked by
gauge invariance (11) to the time-even
 term, a fully self-consistent variation of C1T would require
refitting the whole time-even sector of the Skyrme functional. (Note
that our approach removes the constraints (34) that link
CtT to the time-even coupling constants
term, a fully self-consistent variation of C1T would require
refitting the whole time-even sector of the Skyrme functional. (Note
that our approach removes the constraints (34) that link
CtT to the time-even coupling constants  and
and
 .
The constraint was retained, however, when Sk0' was
constructed.) We leave that task for the future, using a
gauge-invariance breaking-energy functional here with
.
The constraint was retained, however, when Sk0' was
constructed.) We leave that task for the future, using a
gauge-invariance breaking-energy functional here with
 to obtain constraints on C1T for future fits.
Figure 10 shows the change in the GT resonance when
g1' is varied in the range
to obtain constraints on C1T for future fits.
Figure 10 shows the change in the GT resonance when
g1' is varied in the range
 .
Increasing
g1' increases the energy of the GT resonance for a given g0'.
Changing g1' by 0.2 has nearly the same effect on the GT resonance
energy as changing g0' by 0.2. (This means that g0'=1.2,
g1'=0.2, as used here, is consistent with the lower end of
the values
.
Increasing
g1' increases the energy of the GT resonance for a given g0'.
Changing g1' by 0.2 has nearly the same effect on the GT resonance
energy as changing g0' by 0.2. (This means that g0'=1.2,
g1'=0.2, as used here, is consistent with the lower end of
the values
 ,
g1'=0.0 given in
[45,46,47,48].) As the curves for 208Pb and
112Sn demonstrate, however, the amount of strength in the resonance
does not necessarily change when g1' is varied.
,
g1'=0.0 given in
[45,46,47,48].) As the curves for 208Pb and
112Sn demonstrate, however, the amount of strength in the resonance
does not necessarily change when g1' is varied.
Next: Regression analysis of the
Up: GT resonances from generalized
Previous: Study of .
Jacek Dobaczewski
2002-03-15